
Published February 6, 2019
So How Did The Greater Phoenix Area Real Estate Market Fare In January 2019?

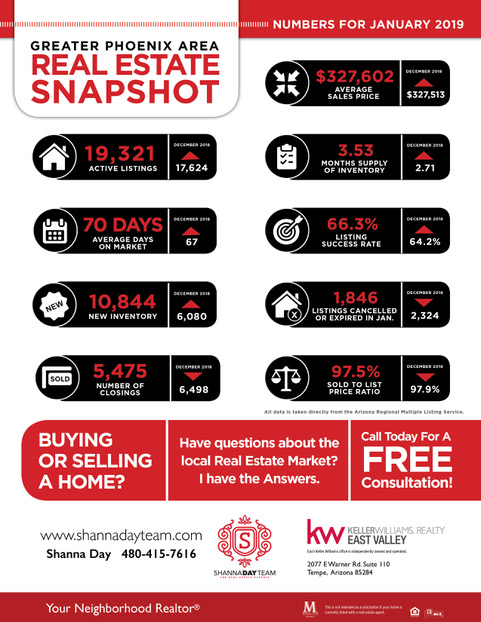
Things are off to a positive start with active listings going up to 19,321 this January from 17,624 from December of last year with new inventory shooting up to 10,844 from 6,080. The current supply should be good for around three and a half months which is a definite improvement from the 2.71 months back in the last month of 2018.
There are lesser cancellations and expirations as well, going down from December's 2,324 to 1,846 posted January of this year.
December might have more closings at 6,498 to the succeeding month's 5,475 but the differences between the average days on the market and sold to list price ratio between the two months weren't too big, with 67 days versus 70 days and 97.9% to 97.5% respectively.
Sellers should find quite the positive trend too with the average sales price increasing from $327,513 to $327,602 and the listing success rate improving from 64.2% to 66.3%. And if these numbers make you want to sell your home, have it sold fast and for top dollar with The Shanna Day Team!
So How Did The Greater Phoenix Area Real Estate Market Fare In January 2019?
|


or another way